 eAtlas Data Catalogue
James Cook University (JCU)
Type of resources
Topics
Keywords
Contact for the resource
Provided by
Years
status
-
The exposure of Great Barrier Reef coral reef and seagrass ecosystems to contaminants is estimated from the synthesis of: river discharge, water quality data sampled in inshore sites during flood conditions and the use of remote sensing technology to estimate flood plume extents and duration. River discharge: Daily mean, maximum and minimum river discharge (Megaliters/day) from 36 rivers, plus their quality control code (as in the DERM web page –Department of the Environment and Resource Management, Qld Government, http://watermonitoring.derm.qld.gov.au/host.htm) dated from 1915 (Barron River at Kuranda) up to current date. Rivers current in the data base are: Barron River at Kuranda, Calliope River at Castlehope, Mossman River at Mossman, Waterpark Creek at Byfield, Fitzroy River at The Gap, Kolan River at Springfield, Sandy Creek at Homebush, North Johnstone River at Tung Oil, Endeavour River at Flaggy, Daintree River at Bairds, O'Connell River at Caping Siding, Haughton River at Powerline, Murray River at Upper Murray, Mulgrave River at Peets Bridge, Tully River at Euramo, Baffle Creek at Mimdale, Black River at Bruce Highway, Carmila Creek At Carmila, Ross River at Ross River Dam Headwater, South Johnstone River at Upstream Central Mill, Burdekin River at Clare, Pioneer River at Mirani Weir Tailwater, Russell River at Bucklands, Mary River at Home Park, Barron River at Myola, Herbert River at Ingham, Don River at Reeves, Burrum River at Lenthalls Dam Release, Annan River at Beesbike, Proserpine River at Proserpine, Boyne River at Milton, Burnett River at Figtree Creek, Rocky Dam Ck, O'Connell River at Stafford's Crossing, Normanby River at Kalpower Crossing, and Pioneer River at Dumbleton Weir T/W. Water Quality: Near-shore water quality data has been measured from direct water mainly sampled at the surface, since 1991 as part of the Water Quality Monitoring Plan for the Great Barrier Reef lagoon. Sometimes stratified samples using Niskin bottle has been also carried out. Water samples are analyzed for: TSS (mg/l), chl-a (µg/l), phaeo-a (µg/l), cdom (440), Si (µM), DIP (µM), DOP (µM), TDP (µM), PP (µM), TP (µM), NO2 (µM), NO3 (µM), NOX (µM), NH4 (µM), DIN (µM), DON (µM), TDN (µM), PN (µM), TN (µM), POC (µM), DOC (µM), and the pesticides Ametryn, Atrazine, Bromacil, Desethyl-A, Desisoprop, Diuron, Fluometuro, Hexazinone, Imidaclopr, Metolachlo, Prometryn, Simazine, Tebuthiuro, and Terbutryn. Water temperature, salinity, light and dissolved oxygen are also determined using a Sea-Bird profiler. Each sample is identified in the water quality table by its name, latitude, longitude, sampling time and date. All sample analyses are carried out by the ACTFR laboratory, except for pesticides, which are processed at University of Queensland. The Sea-Bird profiles are treated before inclusion into the data base, and outliers are masked. Remote sensing: The data base has an inventory of ~3000 MODIS imagery, including Aqua and Terra sensors. Because the main focus of our team research is to understand the influence of river plumes on the Great Barrier Reef, a more comprehensive temporal coverage covers the period form January to April from 2003 to 2011 (mainly MODIS Aqua imagery). The processed images were done up to level-2 and the main products extracted are CDOM as adg_443, nLw_667, bbq_555_qaa (both used as a proxy for turbidity) and chlorophyll as chl_gsm. True color images are also available for most of the images that have been processed.
-
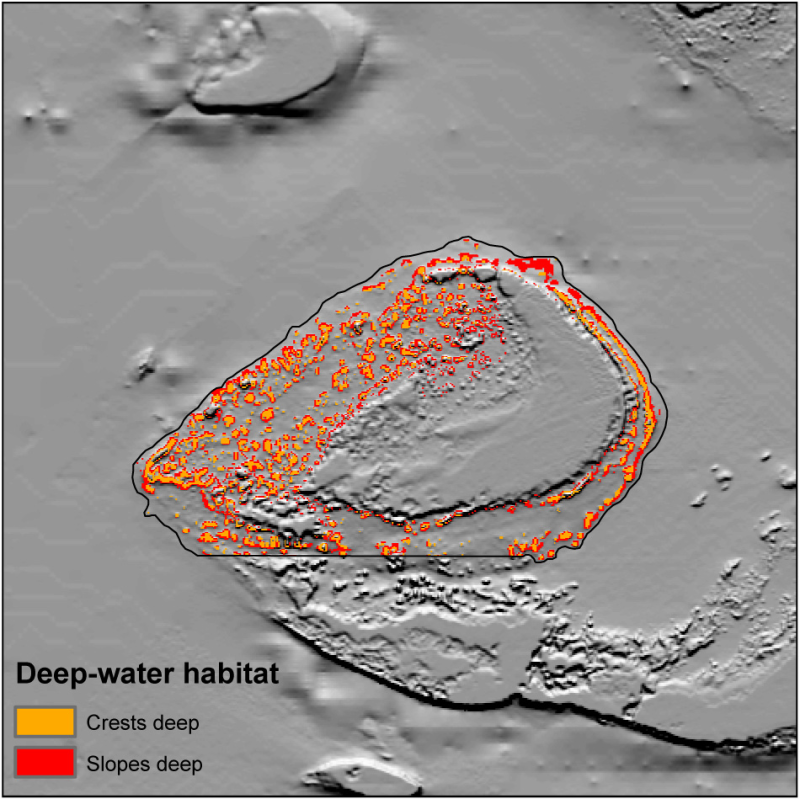
This project integrated all the available source bathymetry data currently used within the latest gbr100 grid and generated a much higher-resolution gbr30 bathymetry grid (~30 m pixel spacing) over the GBR shelf area. The gbr30 grid is recommended for use as a spatial dataset to feed into the Local and Regional Decision Support Tool (DST) being developed by CSIRO for Integrated Pest Management. Other uses of the grid may extend beyond COTS control efforts to include hydrodynamic modelling, natural hazard assessment, to plan and build offshore infrastructure, and to benefit tourism and fishing. The gbr30 grid was then used to generate spatial datasets and descriptive statistics of 22 selected 'super spreader' and tourism reefs, to better understand the extent of deep-water habitat at these sites. An assessment was conducted on whether submerged banks or deeper reefs may provide deep-water coral habitat for COTS, and the implications for the design of the control program. Methods: * Development of gbr30 bathymetry grid The project used the following bathymetry datasets to develop the gbr30 grid: - MBES source data The Australian Hydrographic Office (AHO)-supplied the majority of multibeam echo sounder (MBES) data on the GBR shelf. Geoscience Australia (GA) provided other MBES data, acquired mostly offshore by Australia’s Marine National Facility vessels and also foreign research vessels transiting through the area. Extensive editing on the source data were conducted using QPS Fledermaus and Caris HIPS&SIPS software, and by applying sound velocity and mean sea level (MSL) tide corrections where necessary. - SBES source data The AHO have conducted extensive singlebeam echo sounder (SBES) surveys across the GBR shelf for safety of navigation purposes. Other SBES data were from Maritime Safety Queensland (MSQ), various Queensland Port Authorities and from older National Mapping Division surveys. Data editing were conducted on 3D point clouds generated with Fledermaus software, and lowest astronomical tide (LAT) to MSL tide corrections applied using the Australian Vertical Datum Transformation Tool (AusCoastVDT). - ENC source data Electronic Navigational Chart (ENC) spot depths were generated from S-57 files provided by the AHO and broadly cover the entire GBR shelf and the upper slope. These spot depths were extracted from S-57 files using an ESRI file geodatabase and the xyz data imported to Fledermaus software for examining as 3D point clouds. The accepted bathymetry data were then exported from Fledermaus and LAT-MSL adjustment conducted with AusCoastVDT prior to interpolation of the depth model. - ALB source data Airborne lidar bathymetry (ALB) data were from extensive, AHO-supplied Laser Airborne Depth Sounder (LADS) surveys conducted over the GBR since 1993. Other ALB data were from the Sunshine Coast for the CRC for Spatial Information, and from the Torres Strait using the Fugro SHOALS-1000T system. ALB depths are typically limited to ~40 m. Bathymetry data were imported to Fledermaus software for editing and then LAT-MSL adjustment conducted with AusCoastVDT. - ITEM source data The ITEM DEM data were derived from the Intertidal Extents Model (ITEM v1.0), a nationalscale gridded dataset characterising the spatial extents of the exposed intertidal zone, based upon a full 28 year time series of Landsat observations. ITEM DEM data have 25 m point spacing and have a MSL vertical datum. This version of the gbr30 grid only has ITEM DEM data southwards from latitude 23° South. Future versions of the grid will include ITEM DEM along the remaining intertidal zone. - SDB source data Satellite derived bathymetry (SDB) data utilise optical imagery and rely on physics- or empirical-based techniques to extract depth data. The Queensland Government-supplied SDB data were created by Earth Observation and Environmental Services (EOMAP) using physicsbased Landsat8 for the Gladstone area. EOMAP supplied SDB data using physics-based Landsat8 for offshore Coral Sea reefs. Other SDB data used empirical-based Landsat7/8 data to supplement those reefs on the GBR lacking ALB data. SDB data are limited to ~20 m depth. - Coastline source data Coastline source data are used to ‘pin’ the bathymetry grid at the coast in order to prevent ‘bleeding’ of land into the water during the grid development phase. Coastline data were only used where the higher priority ITEM DEM data were absent, e.g. the coast northwards of latitude 23° South. The Queensland Government-supplied coastline data were rasterised and converted to 25 m point spacing files, then AusCoastVDT used to apply a mean high water springs elevation value to the data. - SRTM Source data The 1 arcsec (~27 m) Shuttle Radar Topographic Mission (SRTM) digital surface model (DSM) data were used as land elevation data for the gbr30 model. The DSM data best represents the topography of the mainland and islands, but also includes vegetation features. The 27 m data were resampled to 30 m to match the interpolated bathymetry grid pixel size. During the grid development phase, the SRTM-DSM data were merged onto the interpolated bathymetry grid to complete the gbr30 grid. * Grid development The final grid development phase was conducted using Generic Mapping Tools (GMT) software (Wessel & Smith, 1991), following the methodology used in Becker et al. (2009). The xyz source data were first decimated using GMT blockmedian into individual xyz data files representing single node points at 15 m-resolution. The decimated data files were then concatenated into one large xyz file. Next, GMT blockmedian was conducted on the single large file to decimate the combined data to 30 m-resolution in order to produce one valid depth point for each pixel location to be used in the interpolated bathymetry grid at that same 30 mresolution. The 30 m xyz data were then compared with co-located depths from an underlying base grid, in this case the 250 m-resolution AusBathyTopo grid (Whiteway, 2009). The purpose of using a base grid was to flag any new data that may be greatly in error and thus be rejected, and also to provide underlying bathymetry data for pixels that lack coverage by the new source data. The 'repair and replace' method repairs the AusBathyTopo grid, replacing pixels with newer, higher-resolution data. A grid was made with GMT surface using the difference values between the co-located new data and the underlying base data. GMT surface was used to resample the AusBathyTopo grid to 30 m-resolution. The difference grid and the resampled base grid were then added together with GMT grdmath. This resulting netCDF file was converted into an Environmental Systems Research Institute (ESRI) grid. The SRTM-DSM data were then merged with the interpolated bathymetry grid and clipped to produce the final gbr30 bathymetry grid. Format: This dataset consists of spreadsheets and various geospatial files for each of the 22 'super spreader' reefs, and a shapefile identifying the reefs. Data Location: This dataset is filed in the eAtlas enduring data repository at: data\NESP3\AU_NESP-TWQ-3.1.1_CSIRO_COTS-control-strategies\